CLEO "Computer-aided Low-dose Estimation of Osteoarticular disorders"
1.1 Context of the projet
CLEO represents a First Spin-Off project that was launched in 2014 and founded by the “Walloon Region RW” for a duration of three years. The project was founded by Sidi Ahmed Mahmoudi and Fabian Lecron, who hold the position of associate professor, at the faculty on engineering at the University of Mons (UMONS) in Belgium. The project is supported the research development department of UMONS the WSL that contribute on the market study and valuation of the CLEO solution. The project is realized with several partners: CMMI “Centre de Miroscopie et d’Imageire Moléculaire” (Charleroi), Jules Bordet Insutut (Brussels).
1.2 Project scope
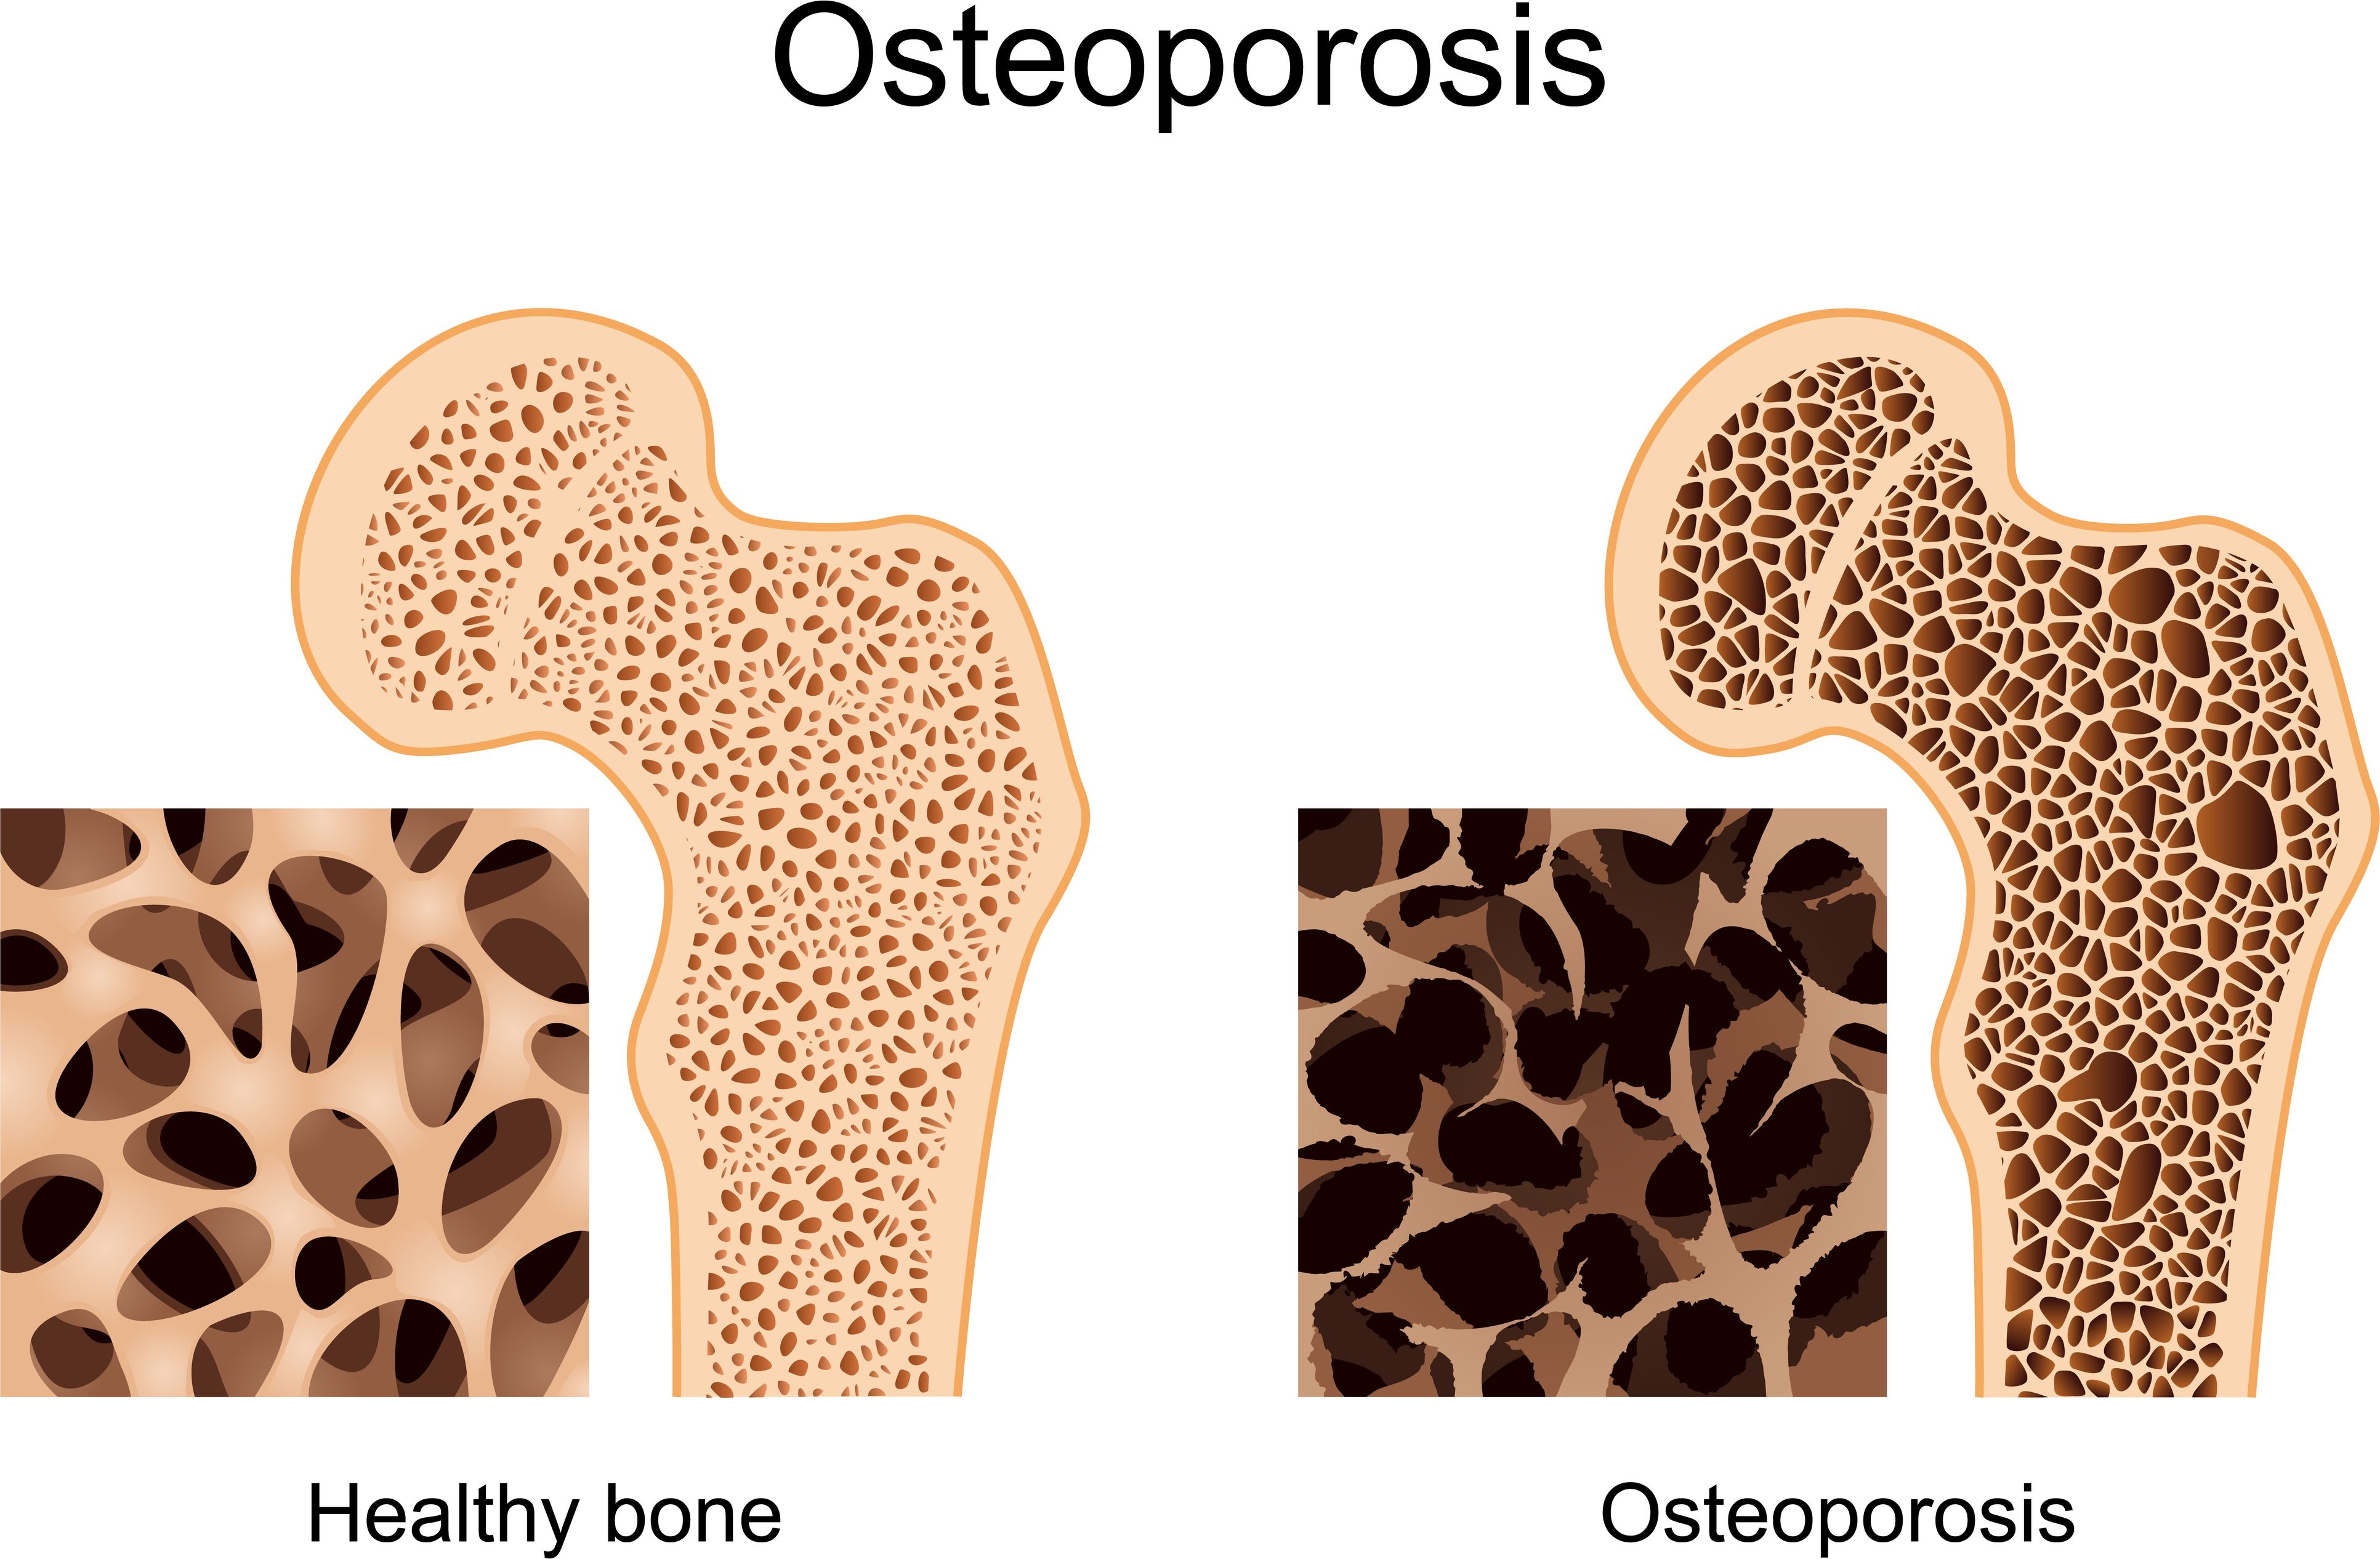
CLEO “Computer-aided Low-dose Estimation of Osteoarticular disorders” is represented by a Cloud-platform that integrates a software of computer aided diagnosis for osteoporosis detection. CLEO allows to estimate the 3D shape (outer envelope), the density and microarchitecture (inside part of bone) which will treat the pathologies of osteoarticular system: Osteoporosis, Scoliosis. Within CLEO, we calculate the different measurements (bone mineral density, T-score, microarchitecture values, etc.) in order to provide an accurate, early and less harmful diagnosis. The calculated indices measured are important in the diagnosis, monitoring and treatment of osteoporosis, which involves excessive fragility of the bones due to a decrease in bone mass and an alteration of the bone microarchitecture.
1.3 CLEO: software description
In order to offer a 3D reconstruction of the bone density and microarchitecture from 2D radiographs, we developed a multiplatform application, implemented within Java. The latter allows extracting information about bone density, trabecular microarchitecture, and cortical microarchitecture.
- Bone density: represented by several metrics such as the BMD (Bone Mineral Density), the volume fraction (fraction of the bone in the total volume) and the T-score that allows to detect bone fragility and osteoporosis.
- Trabecular microarchitecture: represented by serval metric related to the trabecular microarchitecture of the bone such as: the connectivity (between trabecules), the trabecular thickness and the thickness separation (between trabecules).
- Cortical microarchitecture: represented by parameters related to the cortical microarchitecture.
The required parameters of the CLEO software are:
- The 3D volume: represented by the file containing the Dicom5 slices of the bone that we want to analyze.
- Phantom values: represented by some specific points values (in the Phantom) that we know in advance their density values. These pairs of values (point value in HU and density value in mg/cm3) are used to apply a calibration for estimating the density of each point within the 3D volume.
- BMD population: represented by a list of BMD values related to some healthy patients in order to compute the Mean BMD and standard deviation. The latter are used to estimate the T-score that allows to detect osteoporosis.
CLEO is represented by three different versions: Basic, Advanced and Personalized.
-
Basic version: in terms of computation, the basic version allows extracting the density and
microarchitecture (trabecular) values. The density values are represented by several parameters such
as:
- Volume Fraction: represented by the fraction between the bone volume and the total volume.
- BMC: the bone mineral content that represents the density of mineral within the whole bone.
- BMD: the bone mineral density that measures the mean density of minerals in bones. In our case, we use the Phantom values in order to apply a calibration for getting the density of each bone.
- Fractal dimension: provides a statistical index about the pattern complexity of the bone.
-
T-score: represents the bone density compared with normally expected bones from healthy
young adult (BMD population). The Tscore is ranged between -2,5 and 2,5. With this, we can
have three main diagnosis of bone:
- Normal: if the T-score is above that -1.0
- Osteopenia: if the T-score ranged between -1 and -2.5
- Osteoporosis: if the T-score less than -2,5
- Trabecular thickness: represents the mean, standard deviation, and maximum values of thickness of the trabecular bone.
- Trabecular separation: represents the mean, standard deviation and maximum values of separation between trabecular bones.
- Connectivity: represents the trabecular number per mm3 of the bone. Notice that the values of volume fraction, fractal dimension and trabecular microarchitecture are calculated within BoneJ library (Doube M, 2010).
-
Advanced version: this version provides the 3D cortical analysis in addition to the density and
trabecular analysis, already provided within the basic version. The cortical analysis consists of
measuring parameters related to the cortical bone such as:
- Inertia moments: by computing the moments of inertia of the structure, such as a whole bone.
- Slice geometry: by calculating the cross-sectional parameters such as second moment of area and section modulus.
-
Personalized version: this version offers to users the possibility to select their preference for
bone analysis. Indeed, they can select one or several options from:
- 3D bone trabecular analysis
- 3D bone cortical analysis
- 3D-based Anisotropy computation: classify the skeleton branches and junctions
- 3D visualization and reconstruction: of the input and output volumes
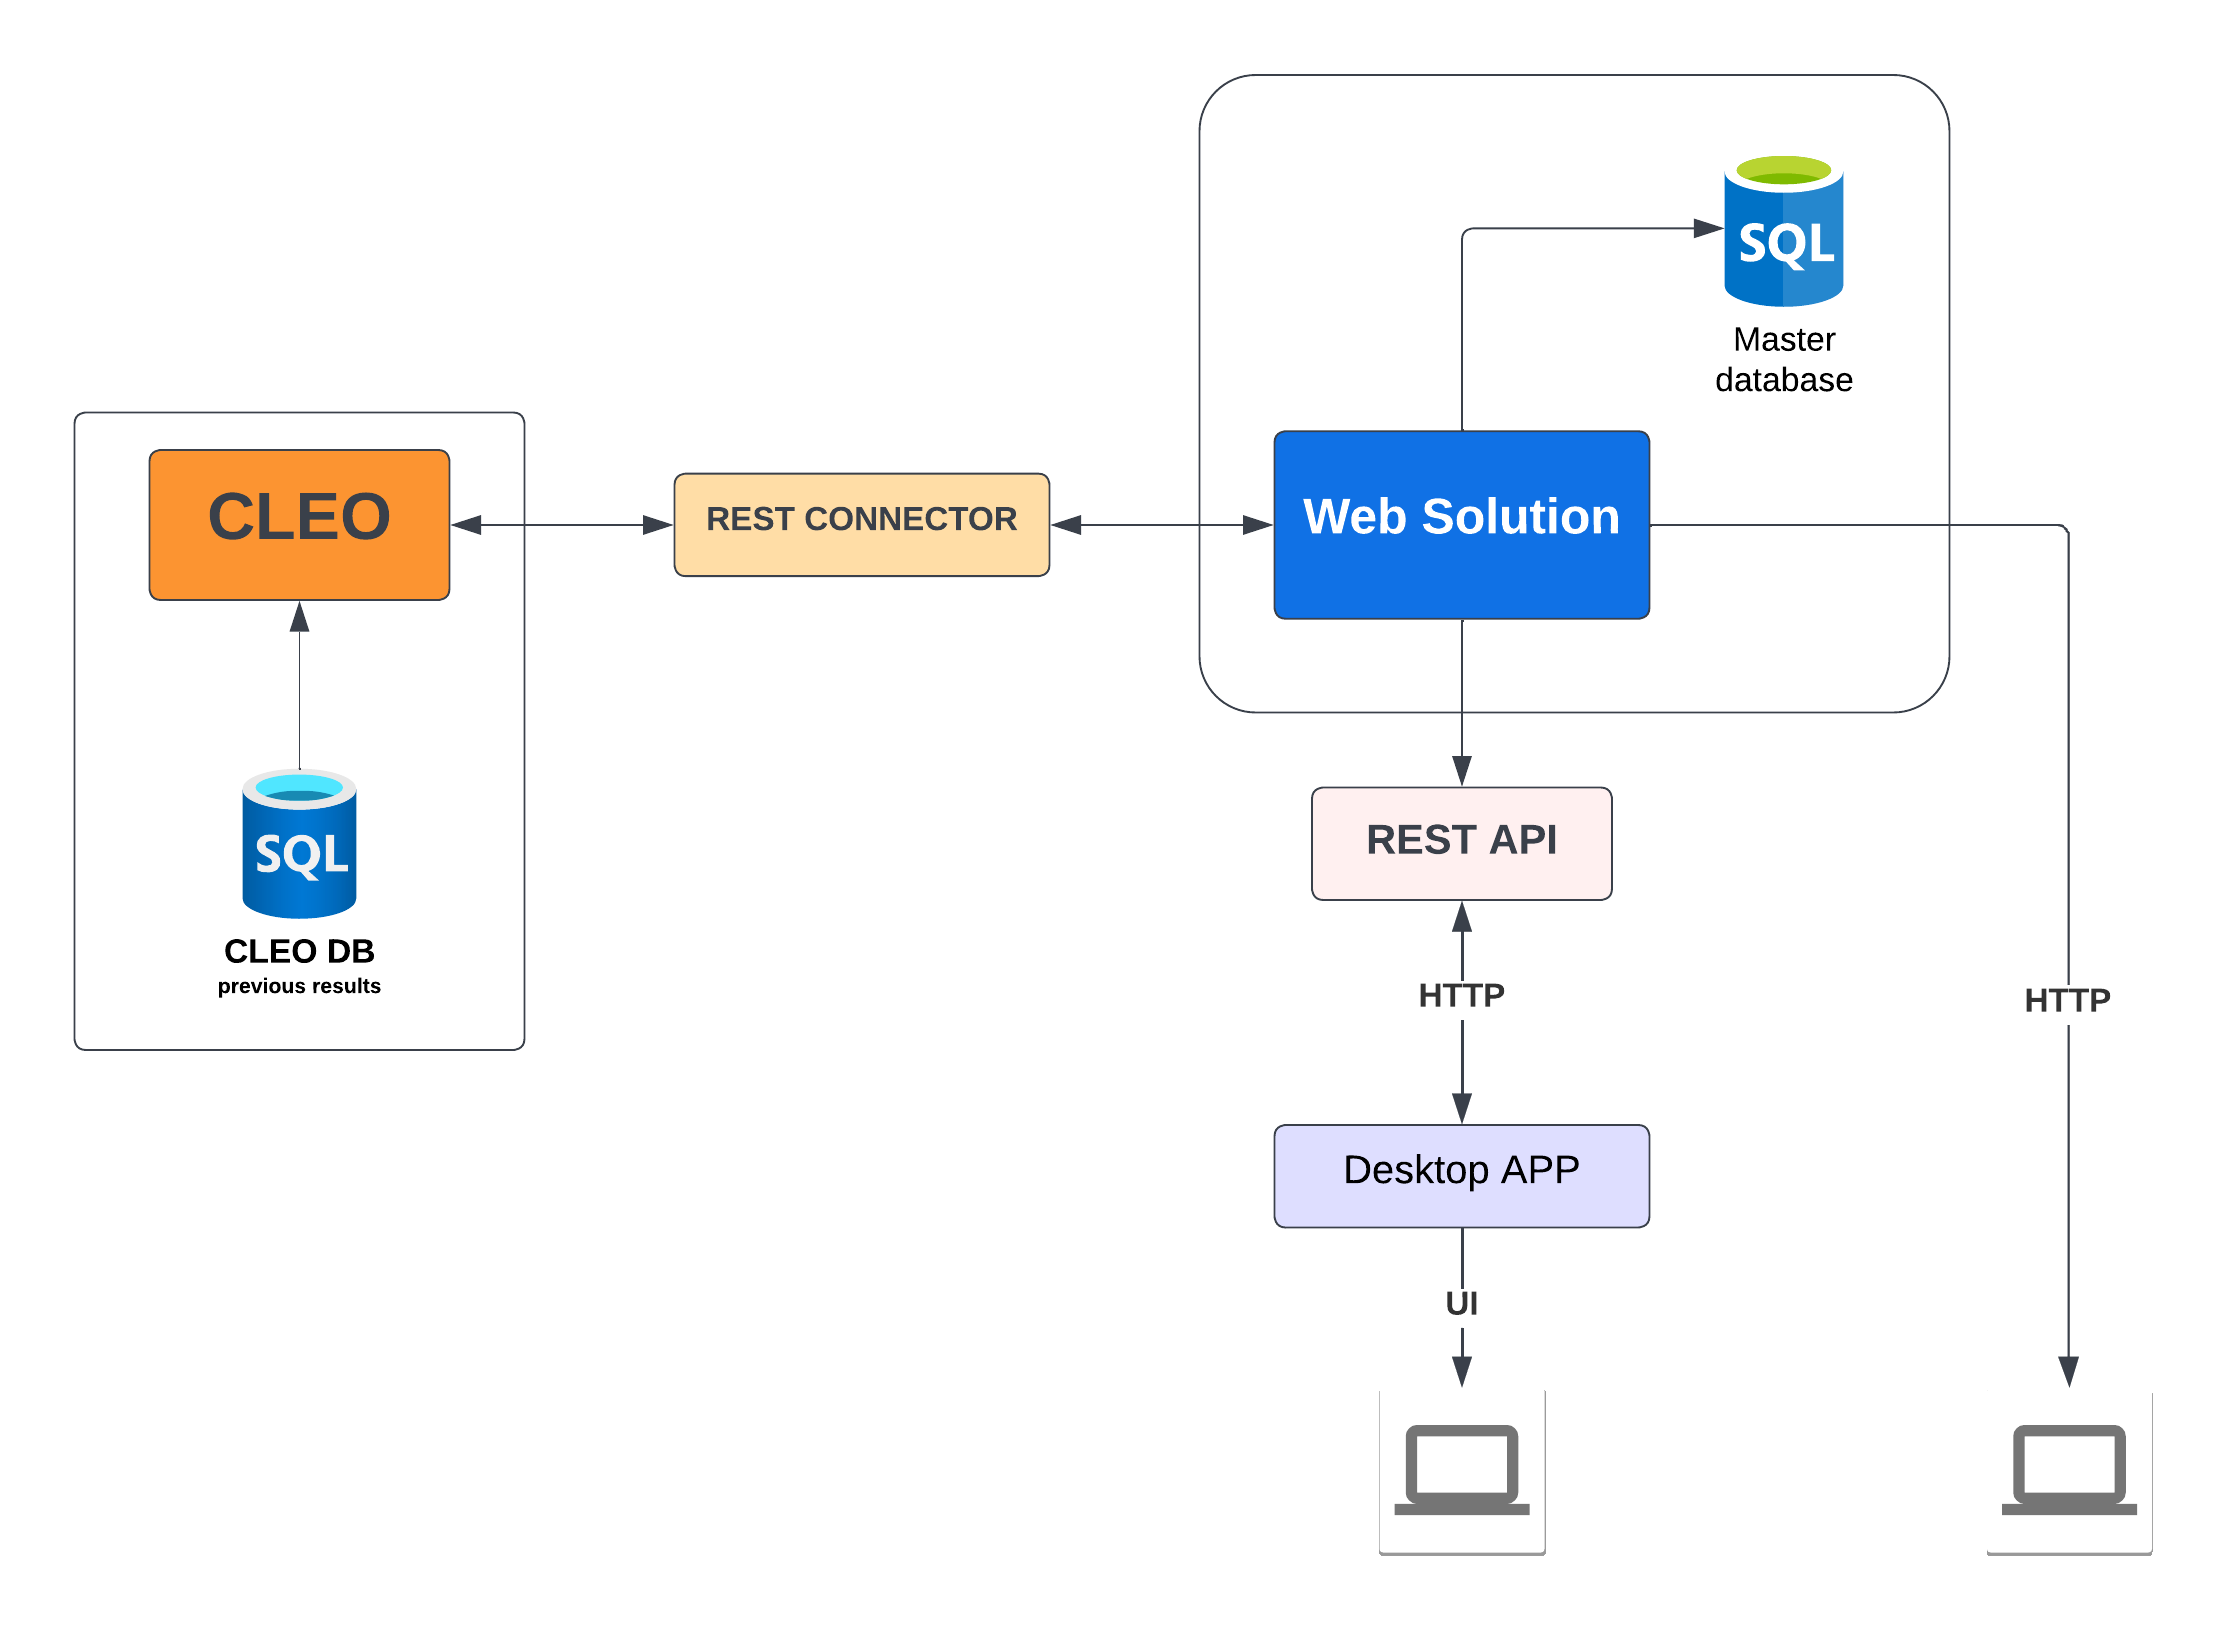
1.4 CLEO: deployment architecture
To ensure good performance of our cloud-based applications, we used three Virtual Machines (VMs). The first one is used as a web server that communicates with the other virtual machines using SFTP and SSH protocols. SFTP is used to send data between machines, and SSH is used to run the application or the encryption of data. The second VM is used to encrypt the data related to medical applications. In this case, users prefer generally to secure their data, which is done with Hadoop architecture. The third VM is used to launch and execute the different applications. For this aim, we have used the Docker framework in order provide a multi-user exploitation of our applications in real time. Different users can run the same application simultaneously.
2. Other applications
Within our cloud-based platform, we have integrated other applications to extend our products and offer:
- CLES: “Computer-aided Low-dose Estimation of Scoliosis”, which allow to detect sideways curvature of the spine which gives an important information of the scoliosis diagnosis.
- Medical Imaging Toolbox: integrating several applications of medical images classification, segmentation and reconstruction using both machine and deep learning models.
- 3D images viewer: a tool that allows to reconstruct 3D volumes based on DICOM slices which offer a more clear visualization for doctors